Unpacking Council Benchmarking - Capital Expenditure
This is the first of a series we will be publishing that provide an evidence-based look at how councils are performing across the country.
Over recent years, Local government has become a convenient punching bag for a range of economic ills. This is only ramping up as we hit the final straight in the local body elections.
We hear a lot about how councils are ‘wasting money’ on shiny new projects and ‘nice to haves’, while failing to focus on their core activities.
At Rationale, we deal in facts and evidence as opposed to opinions, so we decided to task Ben Gonzalez to take a look at the reality of Council capital expenditure across the country, by analysing capex across activities in 2024. This has been done using council benchmarking data recently released by DIA.
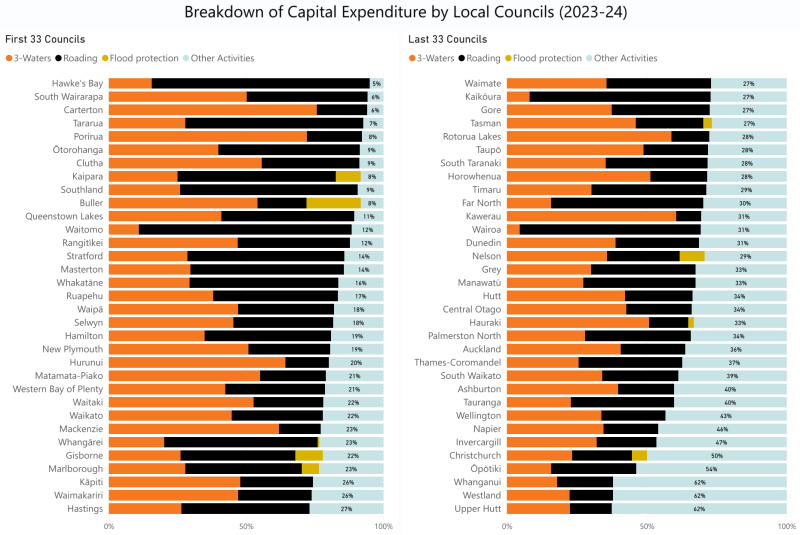
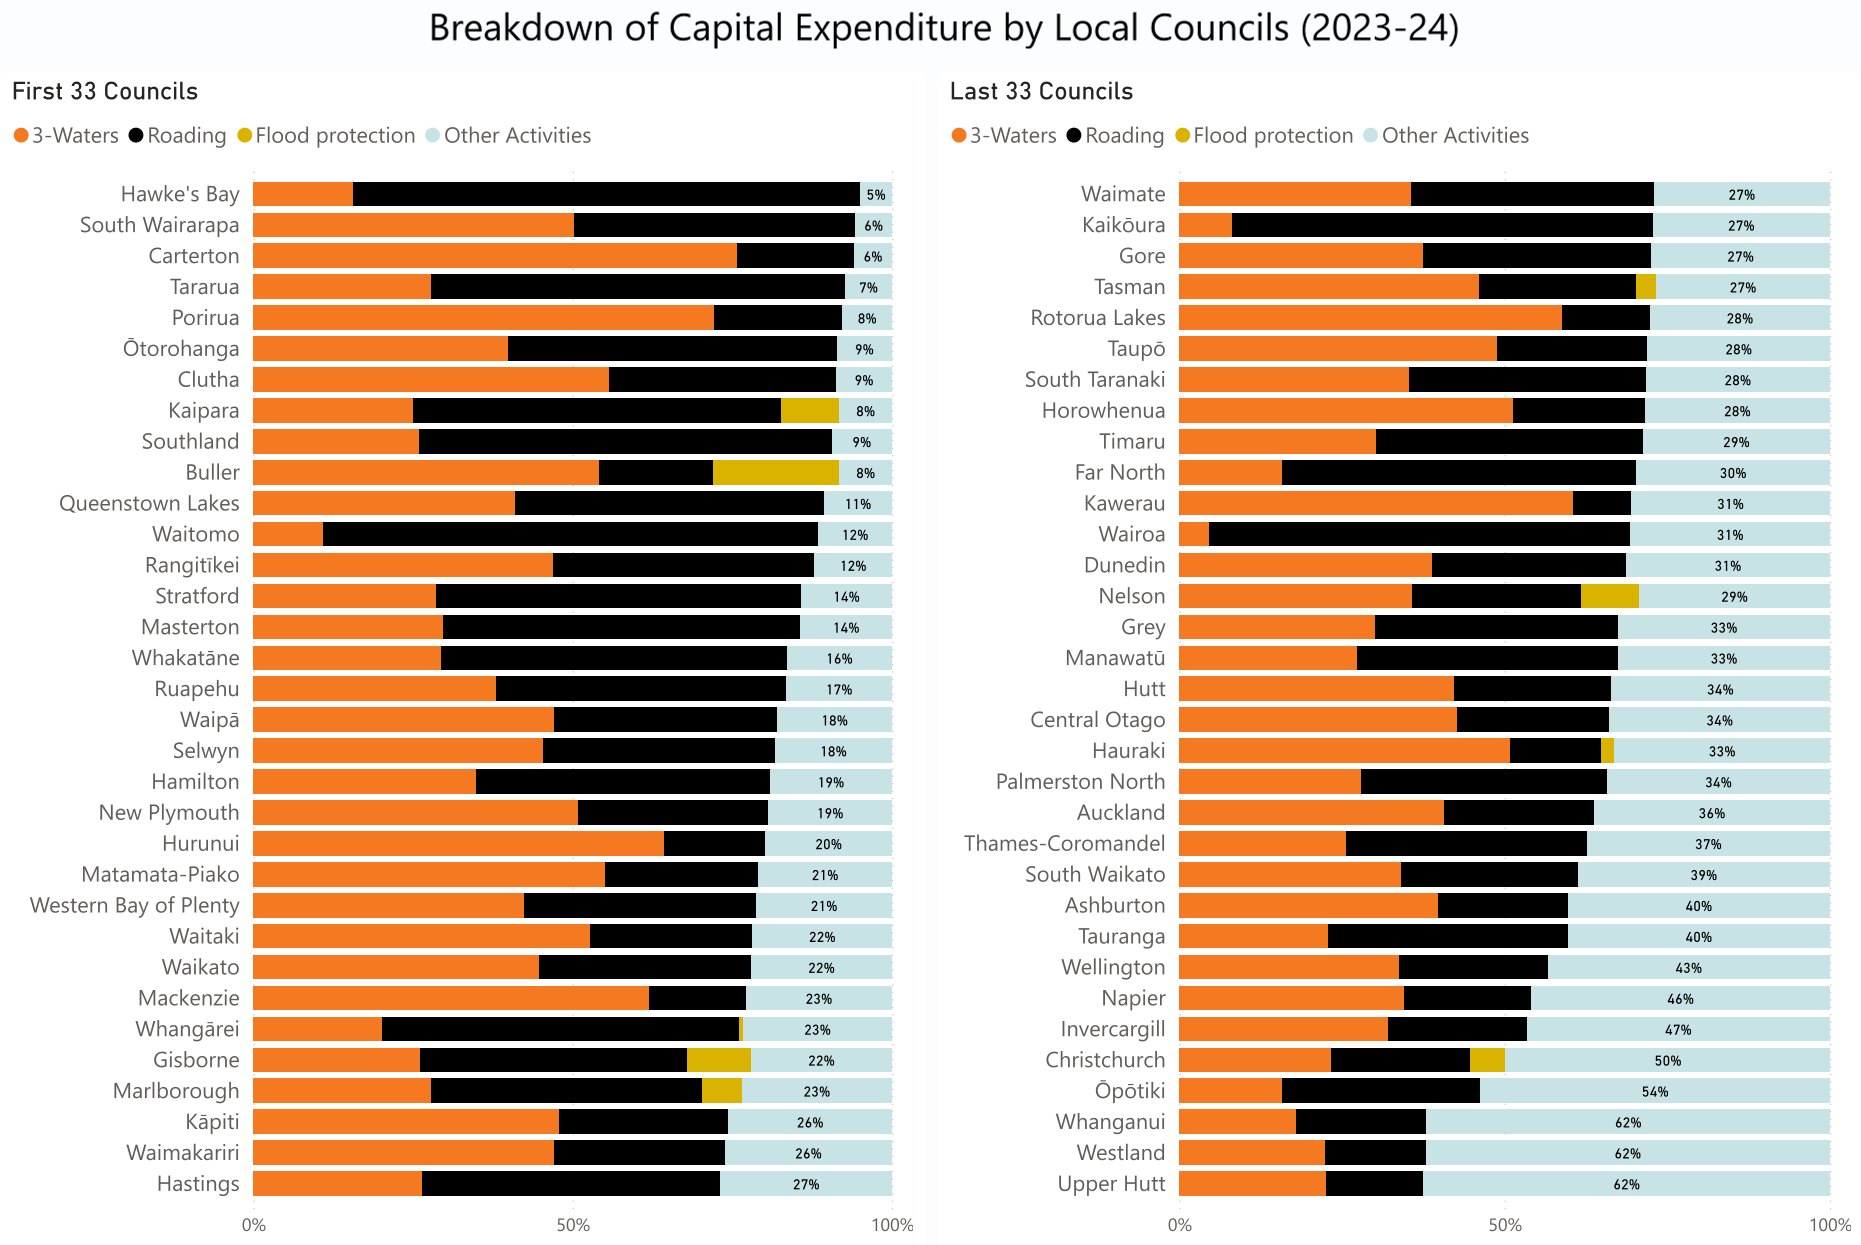
Click here to see a full sized image
What we’ve found, is that despite the rhetoric coming out of some quarters, by and large the majority of most council’s expenditure is on activities that are generally deemed core infrastructure (three waters, roading and flood protection).
In fact, nationally only 14 out of 67 territorial authorities spent more than a third of their capital expenditure on projects outside of three-waters, roading, and flood protection.
Interestingly, taking a national level look, for every $100 of capital expenditure in 2023/24, about $36 went to three-waters, $30 to roading, $1 to flood protection, and $33 to other activities.
That’s before actually defining what determines a core council activity. Things that will be captured as ‘other activities’ include critical community infrastructure such as libraries, swimming pools, and children’s playgrounds etc. – do we genuinely think these are ‘nice to haves’?
Taking a deeper look into the numbers shows us some interesting stories at a local level, for example:
Roading expenditure appears high relative to population in several councils, primarily because these areas have large roading networks compared with their relatively small populations. Queenstown-Lakes stands out due to its large transport programmes to improve arterial routes, driven by rapid population growth, strong tourism demand, and pressure on existing infrastructure.
For three-waters, the standouts are all in the South Island, and include Mackenzie, Hurunui, Clutha, and Queenstown-Lakes, all of which committed large proportions of their capital programmes to water supply, wastewater, and stormwater projects.
Some of the councils with high ‘other activity’ spend include the following:
- Hutt City Council — new pool and fitness centre.
- Westland District Council — much of the ‘other’ spend is in solid waste and the Hokitika Racecourse development.
- Ōpōtiki — harbour development, marine precinct, and CBD enhancements.
- Christchurch — construction of the One NZ Stadium is the standout.
- Invercargill — museum redevelopment, housing, and civic building improvements.
- Wellington — central library and Town Hall strengthening projects account for a large share.
- Tauranga — multiple ‘spaces and places’ projects, including the Civic Centre rebuild programme (Te Manawataki o Te Papa), CBD streetscaping, and park developments.
This isn't to say there aren’t a number of areas for improvement – what business doesn’t have better ways they could cut their cloth?
However, we firmly believe that the value delivered by people’s rates is significantly better than what you get for your taxes. On the whole, local government is doing a good job operating under very challenging conditions.
So next time you hear that councils are wasting ratepayer dollars on vanity projects, take the time to pause and look at the evidence.
If you would like to know more about the detail behind this data, drop us a line, we’re always keen for a chat.
BACK